Cancer risk by age, for men, with smoking, weight and alcohol toggles: out of 10,000 U.S. men aged 50, about 145 die of cancer within ten years. Prostate tops the list of cancers men get at 50, 60, 70 and 80, and reaches the top two of the list that kills only at 70 and 80.
Out of 10,000 men aged 50, about 145 die of cancer within ten years and about 597 are diagnosed with one. At 70 those figures are 744 and 2,013.
Lung cancer is the leading cancer killer of men at all four ages shown. Prostate is the most diagnosed cancer at all four and, among the cancers listed, fifth for deaths at 60 and second at 70 and 80.
The death figures by smoking status are NCI’s own (their any-cancer total adds a small SEER remainder). The diagnosis figures by smoking, weight and alcohol are a DSD estimate, unvalidated, built from NCI baselines and published relative risks.
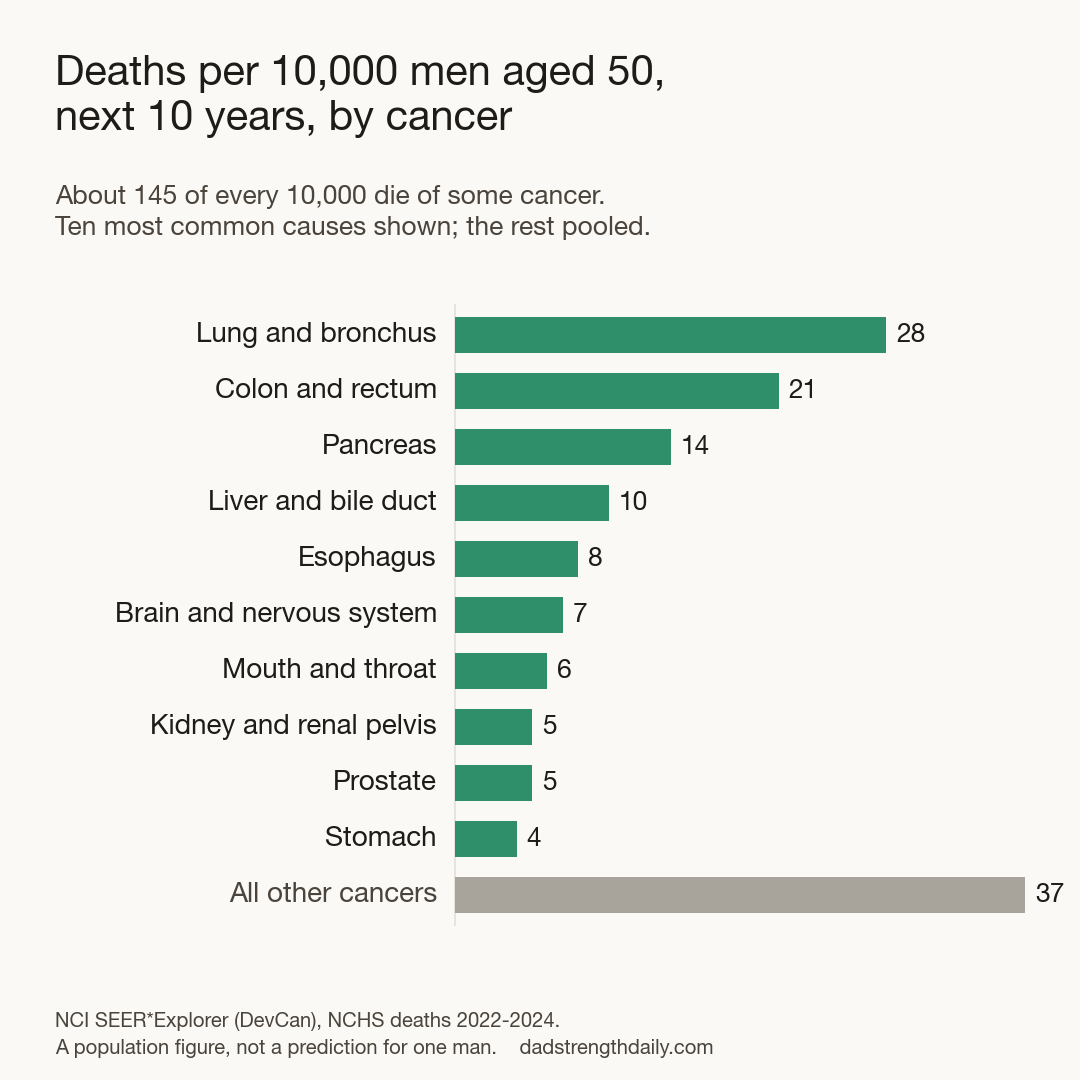
Deaths per 10,000 U.S. men aged 50 over the next ten years, by cancer. NCI SEER*Explorer (DevCan), NCHS deaths 2022 to 2024. A population figure, not a prediction for one man.
I am 53, and every time a friend my age gets a diagnosis I wonder how likely that is for me. So I looked up both lists: which cancers men my age get, and which ones they die from. Prostate leads the first at all four ages SEER offers from 50. Lung leads the second.
The figures come from the National Cancer Institute’s SEER*Explorer, pulled September 15, 2026, shown per 10,000 men because at 50 most cancers kill fewer than one man in a thousand. The tables cover men only; SEER publishes the same figures for women, and the query at the bottom gets you there.
Cancer risk by age chart: men at 50, 60, 70 and 80
At 50, lung cancer kills 28 men per 10,000 within ten years, colon and rectum 21, pancreas 14, liver and bile duct 10. Prostate kills 5, the same as kidney after rounding. By 70 the total has grown from 145 to 744, lung is 175 and prostate is second at 80.
Diagnoses run in a different order. Prostate is first at each age: 181 per 10,000 at 50, 545 at 60, 704 at 70. Bladder climbs from eighth at 50 to third at 70. Kidney and melanoma are in the top seven at 50 and, of the cancers listed, eighth and thirteenth for deaths.
Now flip the smoking toggle. For a man of 60 who never smoked, NCI’s Know Your Chances puts lung at 28 deaths per 10,000 rather than 96, and colon and rectum (35) and pancreas (33) move ahead of it. For a current smoker at 60, lung is 314, more than six times the next cancer.
AgeMen
List
Smoking
Weight
Alcohol
Cancer
Per 10,000
Any cancer
145
Lung and bronchus
28
Colon and rectum
21
Pancreas
14
Liver and bile duct
10
Esophagus
8
Brain and nervous system
7
Mouth and throat
6
Kidney and renal pelvis
5
Prostate
5
Stomach
4
Non-Hodgkin lymphoma
4
Leukemia
4
Melanoma of the skin
3
Bladder (invasive and in situ)
3
Myeloma
2
All other cancers
22
“All other cancers” is everything not listed, so the rows add up to the total before rounding. Not listed (each 2 or fewer): larynx, soft tissue, anus and anal canal, small intestine, thyroid, bones and joints, gallbladder, hodgkin lymphoma, mesothelioma, testis. Deaths: NCHS, total US, 2022-2024, via NCI SEER*Explorer (DevCan).
Cancer
Per 10,000
Any cancer
597
Prostate
181
Colon and rectum
77
Lung and bronchus
43
Kidney and renal pelvis
41
Mouth and throat
33
Melanoma of the skin
32
Non-Hodgkin lymphoma
26
Bladder (invasive and in situ)
23
Liver and bile duct
19
Pancreas
19
Leukemia
18
Stomach
13
Myeloma
12
Esophagus
10
Brain and nervous system
9
Rows do not add up to the total: each counts men free of that cancer at the start, and a man can be diagnosed with more than one. Not listed (each 13 or fewer): thyroid, larynx, small intestine, soft tissue, anus and anal canal, hodgkin lymphoma, testis, bones and joints, gallbladder, mesothelioma. Diagnoses: SEER 21 registries, 2021-2023, via NCI SEER*Explorer (DevCan).
Cancer
Per 10,000
Unvalidated DSD estimate: NCI’s all-men diagnosis figure split by smoking, weight and alcohol with published relative risks for associations IARC classifies as established (Islami et al., 2024; alcohol from Bagnardi et al., 2015), calibrated to the 2022 NHIS mix of U.S. men in this age band. The smoking relative risks are for death, applied to diagnosis as Islami et al. did; some are pooled across sexes. Where a link is not established for the whole site, that factor leaves the row unchanged; the relative-risk table below the tables lists every pair. The any-cancer row combines the listed cancers and the cancers not listed as competing risks, calibrated to NCI’s all-sites figure, so the rows do not add up to it, as in NCI’s own diagnosis table. Effects are assumed to multiply and to hold for the decade at every age. Changing a control shows a different group of men, not what changing a habit would do. Method and inputs: the section below the tables.
Men aged 50 by smoking status: never, former, current (NCI Know Your Chances)
Cancer
Per 10,000
Any cancer
108
Colon and rectum
19
Pancreas
12
Lung and bronchus
9
Brain and nervous system
8
Liver and bile duct
8
Prostate
5
Non-Hodgkin lymphoma
4
Kidney and renal pelvis
4
Esophagus
4
Stomach
3
Melanoma of the skin
3
Leukemia
3
Myeloma
3
Mouth and throat
3
Bladder (invasive and in situ)
1
NCI Know Your Chances, men, NCHS deaths 2020-2022, split by smoking status (Woloshin et al., 2023); a different dataset and years from the all-men tables, so compare rankings, not single cells. The any-cancer row is the sum of the 25 cancers it lists plus SEER’s small remainder, taken as the same for every smoking status. Leukemia is the sum of its five listed types.
Cancer
Per 10,000
Any cancer
136
Colon and rectum
21
Lung and bronchus
16
Pancreas
12
Liver and bile duct
11
Esophagus
10
Brain and nervous system
8
Kidney and renal pelvis
6
Prostate
5
Stomach
5
Mouth and throat
4
Non-Hodgkin lymphoma
4
Leukemia
3
Bladder (invasive and in situ)
3
Melanoma of the skin
3
Myeloma
3
NCI Know Your Chances, men, NCHS deaths 2020-2022, split by smoking status (Woloshin et al., 2023); a different dataset and years from the all-men tables, so compare rankings, not single cells. The any-cancer row is the sum of the 25 cancers it lists plus SEER’s small remainder, taken as the same for every smoking status. Leukemia is the sum of its five listed types.
Cancer
Per 10,000
Any cancer
247
Lung and bronchus
90
Colon and rectum
23
Pancreas
18
Liver and bile duct
16
Esophagus
14
Mouth and throat
14
Brain and nervous system
7
Kidney and renal pelvis
7
Prostate
7
Stomach
6
Bladder (invasive and in situ)
5
Non-Hodgkin lymphoma
4
Leukemia
4
Melanoma of the skin
3
Myeloma
3
NCI Know Your Chances, men, NCHS deaths 2020-2022, split by smoking status (Woloshin et al., 2023); a different dataset and years from the all-men tables, so compare rankings, not single cells. The any-cancer row is the sum of the 25 cancers it lists plus SEER’s small remainder, taken as the same for every smoking status. Leukemia is the sum of its five listed types.
Men aged 60: the same two lists
Cancer
Per 10,000
Any cancer
394
Lung and bronchus
96
Colon and rectum
37
Pancreas
35
Liver and bile duct
32
Prostate
27
Esophagus
19
Brain and nervous system
13
Mouth and throat
13
Kidney and renal pelvis
13
Leukemia
12
Non-Hodgkin lymphoma
11
Bladder (invasive and in situ)
10
Stomach
8
Myeloma
6
Melanoma of the skin
6
All other cancers
56
“All other cancers” is everything not listed, so the rows add up to the total before rounding. Not listed (each 5 or fewer): larynx, soft tissue, anus and anal canal, bones and joints, gallbladder, hodgkin lymphoma, mesothelioma, small intestine, thyroid, testis. Deaths: NCHS, total US, 2022-2024, via NCI SEER*Explorer (DevCan).
Cancer
Per 10,000
Any cancer
1,381
Prostate
545
Lung and bronchus
149
Colon and rectum
109
Bladder (invasive and in situ)
72
Kidney and renal pelvis
70
Melanoma of the skin
66
Mouth and throat
56
Liver and bile duct
52
Non-Hodgkin lymphoma
52
Pancreas
45
Leukemia
39
Stomach
27
Myeloma
26
Esophagus
23
Brain and nervous system
15
Rows do not add up to the total: each counts men free of that cancer at the start, and a man can be diagnosed with more than one. Not listed (each 16 or fewer): thyroid, larynx, small intestine, soft tissue, anus and anal canal, hodgkin lymphoma, bones and joints, gallbladder, mesothelioma, testis. Diagnoses: SEER 21 registries, 2021-2023, via NCI SEER*Explorer (DevCan).
Cancer
Per 10,000
Unvalidated DSD estimate: NCI’s all-men diagnosis figure split by smoking, weight and alcohol with published relative risks for associations IARC classifies as established (Islami et al., 2024; alcohol from Bagnardi et al., 2015), calibrated to the 2022 NHIS mix of U.S. men in this age band. The smoking relative risks are for death, applied to diagnosis as Islami et al. did; some are pooled across sexes. Where a link is not established for the whole site, that factor leaves the row unchanged; the relative-risk table below the tables lists every pair. The any-cancer row combines the listed cancers and the cancers not listed as competing risks, calibrated to NCI’s all-sites figure, so the rows do not add up to it, as in NCI’s own diagnosis table. Effects are assumed to multiply and to hold for the decade at every age. Changing a control shows a different group of men, not what changing a habit would do. Method and inputs: the section below the tables.
Men aged 60 by smoking status: never, former, current (NCI Know Your Chances)
Cancer
Per 10,000
Any cancer
284
Colon and rectum
35
Pancreas
33
Lung and bronchus
28
Prostate
27
Liver and bile duct
24
Brain and nervous system
14
Non-Hodgkin lymphoma
12
Kidney and renal pelvis
10
Esophagus
9
Leukemia
8
Myeloma
8
Stomach
6
Melanoma of the skin
6
Mouth and throat
6
Bladder (invasive and in situ)
5
NCI Know Your Chances, men, NCHS deaths 2020-2022, split by smoking status (Woloshin et al., 2023); a different dataset and years from the all-men tables, so compare rankings, not single cells. The any-cancer row is the sum of the 25 cancers it lists plus SEER’s small remainder, taken as the same for every smoking status. Leukemia is the sum of its five listed types.
Cancer
Per 10,000
Any cancer
383
Lung and bronchus
77
Colon and rectum
39
Liver and bile duct
36
Pancreas
32
Prostate
26
Esophagus
24
Brain and nervous system
14
Kidney and renal pelvis
14
Bladder (invasive and in situ)
12
Non-Hodgkin lymphoma
12
Mouth and throat
10
Leukemia
10
Stomach
9
Myeloma
7
Melanoma of the skin
6
NCI Know Your Chances, men, NCHS deaths 2020-2022, split by smoking status (Woloshin et al., 2023); a different dataset and years from the all-men tables, so compare rankings, not single cells. The any-cancer row is the sum of the 25 cancers it lists plus SEER’s small remainder, taken as the same for every smoking status. Leukemia is the sum of its five listed types.
Cancer
Per 10,000
Any cancer
704
Lung and bronchus
314
Liver and bile duct
49
Pancreas
46
Colon and rectum
40
Prostate
33
Esophagus
32
Mouth and throat
31
Bladder (invasive and in situ)
18
Kidney and renal pelvis
15
Brain and nervous system
13
Leukemia
11
Stomach
11
Non-Hodgkin lymphoma
11
Myeloma
7
Melanoma of the skin
6
NCI Know Your Chances, men, NCHS deaths 2020-2022, split by smoking status (Woloshin et al., 2023); a different dataset and years from the all-men tables, so compare rankings, not single cells. The any-cancer row is the sum of the 25 cancers it lists plus SEER’s small remainder, taken as the same for every smoking status. Leukemia is the sum of its five listed types.
Men aged 70: the same two lists
Cancer
Per 10,000
Any cancer
744
Lung and bronchus
175
Prostate
80
Pancreas
63
Colon and rectum
55
Liver and bile duct
46
Leukemia
33
Esophagus
30
Bladder (invasive and in situ)
28
Non-Hodgkin lymphoma
27
Kidney and renal pelvis
22
Brain and nervous system
20
Mouth and throat
18
Myeloma
16
Stomach
14
Melanoma of the skin
12
All other cancers
106
“All other cancers” is everything not listed, so the rows add up to the total before rounding. Not listed (each 7 or fewer): larynx, soft tissue, mesothelioma, small intestine, bones and joints, gallbladder, thyroid, anus and anal canal, hodgkin lymphoma, testis. Deaths: NCHS, total US, 2022-2024, via NCI SEER*Explorer (DevCan).
Cancer
Per 10,000
Any cancer
2,013
Prostate
704
Lung and bronchus
266
Bladder (invasive and in situ)
155
Colon and rectum
141
Melanoma of the skin
110
Non-Hodgkin lymphoma
88
Kidney and renal pelvis
88
Pancreas
77
Leukemia
71
Liver and bile duct
62
Mouth and throat
61
Myeloma
42
Stomach
41
Esophagus
33
Brain and nervous system
20
Rows do not add up to the total: each counts men free of that cancer at the start, and a man can be diagnosed with more than one. Not listed (each 18 or fewer): larynx, thyroid, small intestine, soft tissue, mesothelioma, anus and anal canal, gallbladder, hodgkin lymphoma, bones and joints, testis. Diagnoses: SEER 21 registries, 2021-2023, via NCI SEER*Explorer (DevCan).
Cancer
Per 10,000
Unvalidated DSD estimate: NCI’s all-men diagnosis figure split by smoking, weight and alcohol with published relative risks for associations IARC classifies as established (Islami et al., 2024; alcohol from Bagnardi et al., 2015), calibrated to the 2022 NHIS mix of U.S. men in this age band. The smoking relative risks are for death, applied to diagnosis as Islami et al. did; some are pooled across sexes. Where a link is not established for the whole site, that factor leaves the row unchanged; the relative-risk table below the tables lists every pair. The any-cancer row combines the listed cancers and the cancers not listed as competing risks, calibrated to NCI’s all-sites figure, so the rows do not add up to it, as in NCI’s own diagnosis table. Effects are assumed to multiply and to hold for the decade at every age. Changing a control shows a different group of men, not what changing a habit would do. Method and inputs: the section below the tables.
Men aged 70 by smoking status: never, former, current (NCI Know Your Chances)
Cancer
Per 10,000
Any cancer
550
Prostate
80
Pancreas
62
Colon and rectum
53
Lung and bronchus
52
Liver and bile duct
32
Non-Hodgkin lymphoma
30
Leukemia
23
Brain and nervous system
20
Myeloma
18
Kidney and renal pelvis
17
Bladder (invasive and in situ)
15
Esophagus
15
Melanoma of the skin
12
Stomach
11
Mouth and throat
10
NCI Know Your Chances, men, NCHS deaths 2020-2022, split by smoking status (Woloshin et al., 2023); a different dataset and years from the all-men tables, so compare rankings, not single cells. The any-cancer row is the sum of the 25 cancers it lists plus SEER’s small remainder, taken as the same for every smoking status. Leukemia is the sum of its five listed types.
Cancer
Per 10,000
Any cancer
754
Lung and bronchus
184
Prostate
76
Pancreas
58
Colon and rectum
58
Liver and bile duct
46
Esophagus
36
Bladder (invasive and in situ)
33
Non-Hodgkin lymphoma
28
Leukemia
27
Kidney and renal pelvis
24
Brain and nervous system
20
Myeloma
18
Mouth and throat
15
Stomach
15
Melanoma of the skin
12
NCI Know Your Chances, men, NCHS deaths 2020-2022, split by smoking status (Woloshin et al., 2023); a different dataset and years from the all-men tables, so compare rankings, not single cells. The any-cancer row is the sum of the 25 cancers it lists plus SEER’s small remainder, taken as the same for every smoking status. Leukemia is the sum of its five listed types.
Cancer
Per 10,000
Any cancer
1,283
Lung and bronchus
604
Prostate
89
Pancreas
79
Liver and bile duct
60
Colon and rectum
56
Esophagus
46
Bladder (invasive and in situ)
45
Mouth and throat
44
Leukemia
28
Kidney and renal pelvis
25
Non-Hodgkin lymphoma
24
Brain and nervous system
17
Stomach
17
Myeloma
15
Melanoma of the skin
10
NCI Know Your Chances, men, NCHS deaths 2020-2022, split by smoking status (Woloshin et al., 2023); a different dataset and years from the all-men tables, so compare rankings, not single cells. The any-cancer row is the sum of the 25 cancers it lists plus SEER’s small remainder, taken as the same for every smoking status. Leukemia is the sum of its five listed types.
Men aged 80: the same two lists
Cancer
Per 10,000
Any cancer
1,136
Lung and bronchus
218
Prostate
187
Colon and rectum
85
Pancreas
77
Bladder (invasive and in situ)
68
Leukemia
61
Non-Hodgkin lymphoma
50
Liver and bile duct
45
Esophagus
33
Kidney and renal pelvis
31
Myeloma
29
Mouth and throat
20
Melanoma of the skin
20
Stomach
20
Brain and nervous system
19
All other cancers
172
“All other cancers” is everything not listed, so the rows add up to the total before rounding. Not listed (each 9 or fewer): mesothelioma, larynx, soft tissue, small intestine, bones and joints, thyroid, gallbladder, hodgkin lymphoma, anus and anal canal, testis. Deaths: NCHS, total US, 2022-2024, via NCI SEER*Explorer (DevCan).
Cancer
Per 10,000
Any cancer
2,011
Prostate
457
Lung and bronchus
274
Bladder (invasive and in situ)
204
Colon and rectum
158
Melanoma of the skin
125
Non-Hodgkin lymphoma
103
Leukemia
90
Pancreas
82
Kidney and renal pelvis
72
Liver and bile duct
50
Mouth and throat
49
Myeloma
46
Stomach
44
Esophagus
30
Brain and nervous system
18
Rows do not add up to the total: each counts men free of that cancer at the start, and a man can be diagnosed with more than one. Not listed (each 16 or fewer): larynx, soft tissue, small intestine, mesothelioma, thyroid, anus and anal canal, gallbladder, hodgkin lymphoma, bones and joints, testis. Diagnoses: SEER 21 registries, 2021-2023, via NCI SEER*Explorer (DevCan).
Cancer
Per 10,000
Unvalidated DSD estimate: NCI’s all-men diagnosis figure split by smoking, weight and alcohol with published relative risks for associations IARC classifies as established (Islami et al., 2024; alcohol from Bagnardi et al., 2015), calibrated to the 2022 NHIS mix of U.S. men in this age band. The smoking relative risks are for death, applied to diagnosis as Islami et al. did; some are pooled across sexes. Where a link is not established for the whole site, that factor leaves the row unchanged; the relative-risk table below the tables lists every pair. The any-cancer row combines the listed cancers and the cancers not listed as competing risks, calibrated to NCI’s all-sites figure, so the rows do not add up to it, as in NCI’s own diagnosis table. Effects are assumed to multiply and to hold for the decade at every age. Changing a control shows a different group of men, not what changing a habit would do. Method and inputs: the section below the tables.
About these controls
Per 10,000 U.S. men at the chosen age, next 10 years. Deaths by smoking status: NCI Know Your Chances (50, 60, 70). Diagnoses by smoking, weight and alcohol: a DSD estimate, unvalidated, explained below the tables. Weight: normal is a BMI under 25, overweight 25 to 29.9, obese 30 and over. Alcohol: light is under 12.5 g a day, moderate 12.5 to 50, heavy over 50; one U.S. drink is 14 g. Nothing you click here leaves this page.
Get the next one in your inbox
I write about longevity, training, and preventive health weekly — without the guru worship. Free, no spam, unsubscribe whenever.
Why the diagnosis list and the death list rank differently
Prostate cancer is found by PSA testing, and the American Cancer Society’s statistics report (Siegel et al., CA, 2026) attributes the early-1990s spike in male cancer incidence to the spread of that test, so the prostate diagnosis figure moves with how many men get tested. Bladder’s row is high partly by definition: SEER counts in-situ tumors there and nowhere else on this page. Pancreatic cancer is the opposite case; SEER puts 51 percent of cases at a distant stage when found, so its two figures sit close together, 19 and 14 at 50.
The 5 prostate deaths at 50 are not 5 of the 181. The diagnosis figure counts men free of that cancer at the start, and a man can be diagnosed with two cancers, so those rows do not add up to the all-cancers total; the death rows do. Dividing one list by the other gives nothing. Prostate diagnoses peak in the decade after 70 (704) while prostate deaths keep climbing into the decade after 80 (187), so during the ten years after 50 prostate diagnoses are common and prostate deaths are rare. The decade with the most diagnoses of any cancer is the one after 70, at 2,013 per 10,000. And the chance of a cancer diagnosis at some point after 50 is 40.9 percent, roughly two men in five; that is a lifetime figure, and it is the one most men have heard.
What these numbers assume
DevCan, the NCI program behind the tool, takes recent diagnosis and death rates and asks what happens to 10,000 men if those rates hold for ten years, allowing for the men who die of something else first. Lung cancer death rates have been falling for years; if that continues, that row runs high. The diagnosis figures come from 21 registries, cases diagnosed 2021 to 2023; the death figures from national death records, 2022 to 2024. Each table carries its own source line, and the full table with confidence intervals is at the bottom.
Cancer risk if you never smoked, and what this page still does not know
How common is lung cancer in non-smokers? For a man who never smoked, NCI’s figures put the ten-year chance of dying from it at 9 per 10,000 at 50, 28 at 60 and 52 at 70, against 28, 96 and 175 for men as a whole. Those come from Know Your Chances, which splits the ten-year chance of dying from each cancer by smoking status using national smoking prevalence and cohort relative risks (Woloshin et al., JAMA Network Open, 2023), on 2020 to 2022 deaths. It is a different dataset from the all-men tables and covers deaths only, and the smoking split shown here runs to 70, so compare rankings across the two, not single cells.
Weight and alcohol are handled by my own estimate on the diagnosis view, described next. Family history, colonoscopy history and any previous cancer are still missing; I have not found a model suitable for a general U.S. audience that turns those into a defensible number across cancers. For screening decisions the U.S. Preventive Services Task Force recommendations are the reference; my reading of the colorectal one is in the colon cancer screening post. The tables stop at 80 because that is the last starting age SEER offers. None of this is medical advice, and a population table is no reason to skip a screening test.
How the personalized estimate is calculated
When you set smoking, weight or alcohol on the diagnosis view, the page computes an estimate, because no agency publishes diagnosis figures split that way. It starts from NCI’s ten-year probability of diagnosis for all men at your exact age. It splits that across 36 combinations: smoking (never, former, current), weight (BMI under 25, 25 to 29.9, 30 and over) and alcohol (none, under 12.5 grams a day, 12.5 to 50, over 50; one U.S. drink is 14 grams). The split uses the relative risks Islami et al., CA, 2024 tabulated for the associations IARC classifies as established, with alcohol dose-response from Bagnardi et al., 2015. It is then calibrated so that, averaged over the mix of those factors among U.S. men in your ten-year age band in the 2022 National Health Interview Survey, it reproduces NCI’s all-men figure exactly. A factor left at “all” takes its mix within the group you did choose. The any-cancer total combines the 15 listed cancers and the cancers not listed as competing risks, calibrated the same way to NCI’s all-sites figure. As in NCI’s own diagnosis table, the rows do not add up to it.
The shortcuts, listed rather than hidden: The smoking relative risks, and myeloma’s weight relative risk, were measured on deaths, and I apply them to diagnoses the way Islami et al. did. Some relative risks pool men and women. The weight effect is a per-five-BMI-unit figure applied at 27.5 and 32.5 against 22.5; using 30 for the obese band instead lowers the kidney estimate at 60, for an obese man who never smoked and does not drink, from 71 to 66 per 10,000, the largest such shift. The factors are assumed to multiply, your habits are assumed to hold for the decade, and a relative risk is treated as the same at 50 and at 80. And the model ignores that a heavy smoker is more likely to die of something else before a cancer is found, which would trim his figures a little. Where IARC has not established a link for the whole site, that factor leaves the row unchanged; the table below lists every pair. One check on how rough this is: NCI’s own smoking split for deaths puts a never-smoker’s lung figure at about 30 percent of the all-men figure; this estimate puts it at 16 to 18 percent for diagnoses at 50 to 70, and 22 percent at 80. Nobody has validated it against outcomes, which is why every table it produces says so, and why a change in the controls describes a different group of men rather than what changing a habit would do for you. The relative risks used are listed with the full data table below.
Full data table with confidence intervals, the relative risks, and the exact query
Deaths per 10,000 U.S. men in the next 10 years, with 95% confidence intervals, every SEER site
Age 50
Age 60
Age 70
Age 80
All Cancer Sites Combined
145.0 (144.2 to 145.8)
393.5 (392.2 to 394.9)
744.3 (742.0 to 746.5)
1136.3 (1132.3 to 1140.4)
Anus, Anal Canal & Anorectum
0.5 (0.5 to 0.6)
0.9 (0.8 to 0.9)
1.1 (1.0 to 1.2)
1.2 (1.0 to 1.3)
Bones and Joints
0.5 (0.4 to 0.5)
1.0 (0.9 to 1.1)
1.7 (1.6 to 1.8)
2.7 (2.5 to 3.0)
Brain and Other Nervous System
7.4 (7.3 to 7.6)
13.5 (13.2 to 13.7)
19.6 (19.3 to 20.0)
19.3 (18.7 to 19.8)
Colon and Rectum (including Appendix)
20.9 (20.6 to 21.2)
36.9 (36.4 to 37.3)
54.5 (53.9 to 55.1)
84.6 (83.5 to 85.8)
Esophagus
7.6 (7.4 to 7.8)
18.9 (18.6 to 19.2)
30.0 (29.5 to 30.5)
32.5 (31.8 to 33.3)
Gallbladder
0.3 (0.3 to 0.4)
0.8 (0.8 to 0.9)
1.8 (1.7 to 1.9)
2.3 (2.1 to 2.5)
Hodgkin Lymphoma
0.3 (0.3 to 0.3)
0.6 (0.5 to 0.7)
1.2 (1.1 to 1.3)
1.9 (1.7 to 2.1)
Kidney and Renal Pelvis
5.5 (5.3 to 5.6)
12.6 (12.3 to 12.8)
21.9 (21.6 to 22.4)
31.5 (30.8 to 32.2)
Larynx
1.8 (1.7 to 1.9)
5.2 (5.0 to 5.3)
7.1 (6.9 to 7.3)
8.0 (7.6 to 8.4)
Leukemia
4.0 (3.9 to 4.2)
12.0 (11.7 to 12.2)
32.7 (32.2 to 33.1)
61.3 (60.3 to 62.3)
Liver and Intrahepatic Bile Duct
9.8 (9.6 to 10.1)
31.7 (31.4 to 32.1)
46.1 (45.6 to 46.7)
45.4 (44.5 to 46.2)
Lung and Bronchus
27.7 (27.3 to 28.0)
95.6 (95.0 to 96.3)
175.3 (174.2 to 176.4)
218.1 (216.3 to 220.0)
Melanoma of the Skin
2.6 (2.5 to 2.7)
5.9 (5.7 to 6.0)
11.9 (11.6 to 12.2)
20.1 (19.6 to 20.7)
Mesothelioma
0.3 (0.3 to 0.3)
1.1 (1.1 to 1.2)
4.2 (4.0 to 4.4)
9.0 (8.6 to 9.4)
Myeloma
2.2 (2.1 to 2.3)
6.5 (6.3 to 6.7)
16.2 (15.8 to 16.5)
29.4 (28.7 to 30.1)
Non-Hodgkin Lymphoma
4.0 (3.9 to 4.2)
10.8 (10.6 to 11.1)
27.0 (26.6 to 27.5)
50.3 (49.4 to 51.2)
Oral Cavity and Pharynx
5.9 (5.7 to 6.0)
13.0 (12.8 to 13.3)
18.2 (17.8 to 18.5)
20.3 (19.7 to 20.8)
Pancreas
13.6 (13.3 to 13.8)
34.8 (34.4 to 35.2)
63.2 (62.5 to 63.9)
77.2 (76.1 to 78.3)
Prostate
5.3 (5.2 to 5.5)
27.3 (26.9 to 27.6)
79.8 (79.0 to 80.5)
186.8 (185.0 to 188.5)
Small Intestine
0.6 (0.5 to 0.6)
1.3 (1.2 to 1.3)
2.5 (2.4 to 2.7)
3.7 (3.4 to 3.9)
Soft Tissue including Heart
1.6 (1.5 to 1.7)
2.9 (2.8 to 3.1)
5.2 (5.0 to 5.3)
7.5 (7.2 to 7.9)
Stomach
4.0 (3.9 to 4.2)
8.3 (8.1 to 8.5)
13.5 (13.2 to 13.9)
19.8 (19.2 to 20.4)
Testis
0.3 (0.2 to 0.3)
0.3 (0.3 to 0.3)
0.3 (0.2 to 0.3)
0.3 (0.2 to 0.3)
Thyroid
0.5 (0.5 to 0.6)
1.2 (1.2 to 1.3)
2.5 (2.3 to 2.6)
3.4 (3.1 to 3.6)
Urinary Bladder (Invasive & In Situ)
2.5 (2.4 to 2.6)
9.8 (9.6 to 10.0)
28.5 (28.0 to 28.9)
68.1 (67.0 to 69.2)
Diagnoses per 10,000 U.S. men in the next 10 years, with 95% confidence intervals, every SEER site
Age 50
Age 60
Age 70
Age 80
All Cancer Sites Combined
597.0 (594.5 to 599.5)
1380.9 (1376.6 to 1385.1)
2013.4 (2006.4 to 2020.4)
2010.9 (1999.3 to 2022.5)
Anus, Anal Canal & Anorectum
3.0 (2.8 to 3.2)
4.6 (4.4 to 4.9)
4.8 (4.5 to 5.1)
4.7 (4.3 to 5.2)
Bones and Joints
1.1 (1.0 to 1.2)
1.6 (1.5 to 1.8)
2.1 (1.9 to 2.2)
2.4 (2.1 to 2.8)
Brain and Other Nervous System
9.2 (8.9 to 9.5)
14.8 (14.4 to 15.2)
19.5 (18.9 to 20.1)
17.9 (17.1 to 18.8)
Colon and Rectum (including Appendix)
76.5 (75.6 to 77.4)
109.2 (108.1 to 110.3)
140.6 (139.0 to 142.2)
158.1 (155.6 to 160.7)
Esophagus
9.8 (9.4 to 10.1)
22.9 (22.4 to 23.4)
33.3 (32.6 to 34.1)
30.4 (29.3 to 31.5)
Gallbladder
0.9 (0.8 to 0.9)
2.1 (2.0 to 2.3)
4.0 (3.8 to 4.3)
5.0 (4.6 to 5.5)
Hodgkin Lymphoma
2.5 (2.4 to 2.7)
3.2 (3.0 to 3.4)
3.8 (3.6 to 4.1)
3.6 (3.2 to 4.0)
Kidney and Renal Pelvis
41.4 (40.8 to 42.1)
70.2 (69.3 to 71.2)
88.1 (86.8 to 89.4)
72.0 (70.3 to 73.8)
Larynx
6.3 (6.1 to 6.6)
15.0 (14.6 to 15.4)
18.4 (17.8 to 19.0)
15.7 (14.9 to 16.5)
Leukemia
17.9 (17.5 to 18.3)
39.3 (38.6 to 39.9)
71.1 (70.0 to 72.2)
90.0 (88.1 to 91.9)
Liver and Intrahepatic Bile Duct
19.1 (18.7 to 19.6)
52.1 (51.4 to 52.9)
62.2 (61.1 to 63.2)
50.2 (48.8 to 51.7)
Lung and Bronchus
43.3 (42.7 to 44.0)
149.5 (148.2 to 150.8)
265.6 (263.4 to 267.8)
274.4 (271.1 to 277.8)
Melanoma of the Skin
32.2 (31.7 to 32.8)
65.8 (64.9 to 66.6)
109.9 (108.4 to 111.3)
124.7 (122.4 to 127.0)
Mesothelioma
0.6 (0.5 to 0.6)
1.8 (1.6 to 1.9)
5.6 (5.3 to 6.0)
9.8 (9.2 to 10.5)
Myeloma
11.8 (11.5 to 12.2)
25.7 (25.1 to 26.2)
42.3 (41.4 to 43.2)
45.7 (44.4 to 47.1)
Non-Hodgkin Lymphoma
26.5 (26.0 to 27.0)
51.8 (51.0 to 52.6)
88.4 (87.1 to 89.6)
103.0 (101.0 to 105.1)
Oral Cavity and Pharynx
32.7 (32.1 to 33.3)
56.0 (55.2 to 56.9)
61.3 (60.2 to 62.3)
48.8 (47.4 to 50.2)
Pancreas
18.6 (18.2 to 19.1)
45.0 (44.3 to 45.7)
76.7 (75.5 to 77.9)
81.8 (80.0 to 83.6)
Prostate
181.2 (179.9 to 182.5)
545.3 (542.8 to 547.8)
703.6 (699.9 to 707.3)
457.0 (452.4 to 461.5)
Small Intestine
4.9 (4.7 to 5.1)
8.8 (8.5 to 9.2)
12.4 (11.9 to 12.9)
12.1 (11.5 to 12.9)
Soft Tissue including Heart
5.0 (4.7 to 5.2)
7.7 (7.4 to 8.0)
12.4 (11.9 to 12.8)
15.7 (14.9 to 16.5)
Stomach
12.9 (12.5 to 13.2)
26.6 (26.0 to 27.1)
40.7 (39.9 to 41.6)
43.7 (42.3 to 45.0)
Testis
3.4 (3.3 to 3.6)
1.8 (1.7 to 2.0)
1.0 (0.9 to 1.2)
0.7 (0.5 to 0.9)
Thyroid
12.9 (12.5 to 13.2)
16.0 (15.6 to 16.4)
16.3 (15.7 to 16.8)
10.0 (9.4 to 10.7)
Urinary Bladder (Invasive & In Situ)
22.6 (22.1 to 23.1)
72.4 (71.5 to 73.3)
154.7 (153.0 to 156.3)
203.9 (201.0 to 206.8)
Relative risks the DSD estimate applies (reference: never smoker, BMI under 25, no alcohol); IARC-established associations only, as tabulated by Islami 2024 (smoking, BMI) and Bagnardi 2015 (alcohol, men)
Smoking
Weight
Alcohol
Lung and bronchus
current 23.86, former 6.80; Islami et al. 2024
not established
not established
Prostate
not established
not established
not established
Colon and rectum
current 1.51, former 1.20; Islami et al. 2024
overweight 1.04, obese 1.08 (per 5 BMI units, applied at 27.5 and 32.5 vs 22.5); Islami et al. 2024
light 1.05, moderate 1.21, heavy 1.53; Bagnardi et al. 2015
Pancreas
current 1.74, former 1.08; Islami et al. 2024
overweight 1.14, obese 1.30 (per 5 BMI units, applied at 27.5 and 32.5 vs 22.5); Islami et al. 2024
not established
Liver and bile duct
current 2.10, former 1.38; Islami et al. 2024
overweight 1.30, obese 1.69 (per 5 BMI units, applied at 27.5 and 32.5 vs 22.5); Islami et al. 2024
light 1.05, moderate 1.08, heavy 1.59; Bagnardi et al. 2015
Bladder (invasive and in situ)
current 3.90, former 2.37; Islami et al. 2024
not established
not established
Kidney and renal pelvis
current 1.55, former 1.38; Islami et al. 2024
overweight 1.29, obese 1.66 (per 5 BMI units, applied at 27.5 and 32.5 vs 22.5); Islami et al. 2024
not established
Melanoma of the skin
not established
not established
not established
Esophagus
current 4.25, former 2.49; Islami et al. 2024
established for adenocarcinoma only; not applied to the whole site
established for squamous cell cancer only; not applied to the whole site
Stomach
current 1.81, former 1.30; Islami et al. 2024
established for cardia cancer only; not applied to the whole site
not applied: Islami 2024 excluded it (no significant association in North America and Europe)
Leukemia
not established for leukemia overall (the RR is for acute myeloid leukemia only)
not established
not established
Non-Hodgkin lymphoma
not established
not established
not established
Mouth and throat
current 5.66, former 1.88; Islami et al. 2024
not established
light 1.20, moderate 2.01, heavy 5.33; Bagnardi et al. 2015
Brain and nervous system
not established
not established
not established
Myeloma
not established
overweight 1.09, obese 1.19 (per 5 BMI units, applied at 27.5 and 32.5 vs 22.5); Islami et al. 2024
not established
Pulled 2026-09-15 from SEER*Explorer (updated 2026-06-22), statistic “Risk of Diagnosis/Dying”, graph “Risk Comparisons” by cancer site, male, all races and ethnicities, precision 0.0001, confidence intervals on. A 20-year window from age 80 is not offered. The raw on-screen values and the site codes are kept in the DadStrengthDaily repository file sources/seer-explorer-risk-by-age-2026-09/raw_captures.py. Suggested citation: SEER*Explorer: An interactive website for SEER cancer statistics [Internet]. Surveillance Research Program, National Cancer Institute; 2026 Apr 22. [updated: 2026 Jun 22; cited 2026 Sep 15]. Available from: https://seer.cancer.gov/statistics-network/explorer/.
I never smoked, so the never-smoked view is mine. At 50, the nearest age to me, lung falls to 9 deaths per 10,000 and colon and rectum tops the list at 19, with about 108 deaths from any cancer against 145 for all men; on the diagnosis side the never-smoked, normal-weight, no-alcohol combination comes out at about 481 of any cancer per 10,000 against 597. Colon and rectum is also the highest cancer on that list with a USPSTF grade A screening recommendation for every man from 50 to 75. I have had one colonoscopy already, for an unrelated iron problem, and I intend to have the next one when it is due.
About Gunnar
Gunnar is 53. He lost about 170 pounds, trains in a garage gym, and writes DadStrengthDaily from personal experience, citing primary sources where he can. He also moderates r/ProactiveHealth. He is not a doctor, and nothing here is medical advice. Talk to your own doctor before acting on anything, especially GLP-1s, TRT, blood pressure, and prostate or cancer screening.