
In 1990, alcohol caused an estimated 11,361 cancer deaths in the US that year. By 2023 — the last year in the data, 33 years later — that annual toll had more than doubled to 23,126. That’s the “alcohol-related cancer deaths doubled since 1990” headline running everywhere this week. It’s accurate, and on its own it doesn’t tell you much about what to actually do.
I went and read the actual study behind the alcohol and cancer deaths headlines. The real finding isn’t the doubling. It’s who the doubling is hiding.
The age-adjusted national rate rose modestly
The paper is from Jani and colleagues at the Sylvester Comprehensive Cancer Center at the University of Miami, published September 2 in The Lancet Regional Health – Americas. It’s open access, and the study itself received no funding. They pulled Global Burden of Disease data for all 50 states plus DC, 1990 through 2023, covering 10 cancer types.
One thing worth knowing before the numbers: alcohol’s contribution to a cancer death is estimated, not directly observed. “Alcohol-attributable” is a modeled figure — researchers take how much a population drinks and how much drinking raises each cancer’s risk, then calculate a share of deaths attributable to alcohol. It’s a statistical assignment, not a body count, but a reasonable one.
Now for the number that matters more than the headline count. The raw death count doubling includes something that has nothing to do with cancer risk: the country got bigger and older over those 33 years. More people, more of them elderly, means more cancer deaths even if nobody’s individual odds changed at all. Adjust for that — age-standardize the rate, which is the fair comparison — and the national rate went from 3.8 to 4.1 deaths per 100,000. An increase of 7.6 percent — a modest rise, not the dramatic jump the raw death count suggests.
A modest national increase can still hide a real split. This one does.
Get the next one in your inbox
I write about longevity, training, and preventive health weekly — without the guru worship. Free, no spam, unsubscribe whenever.
The sharpest rate increase is in men 55 and older
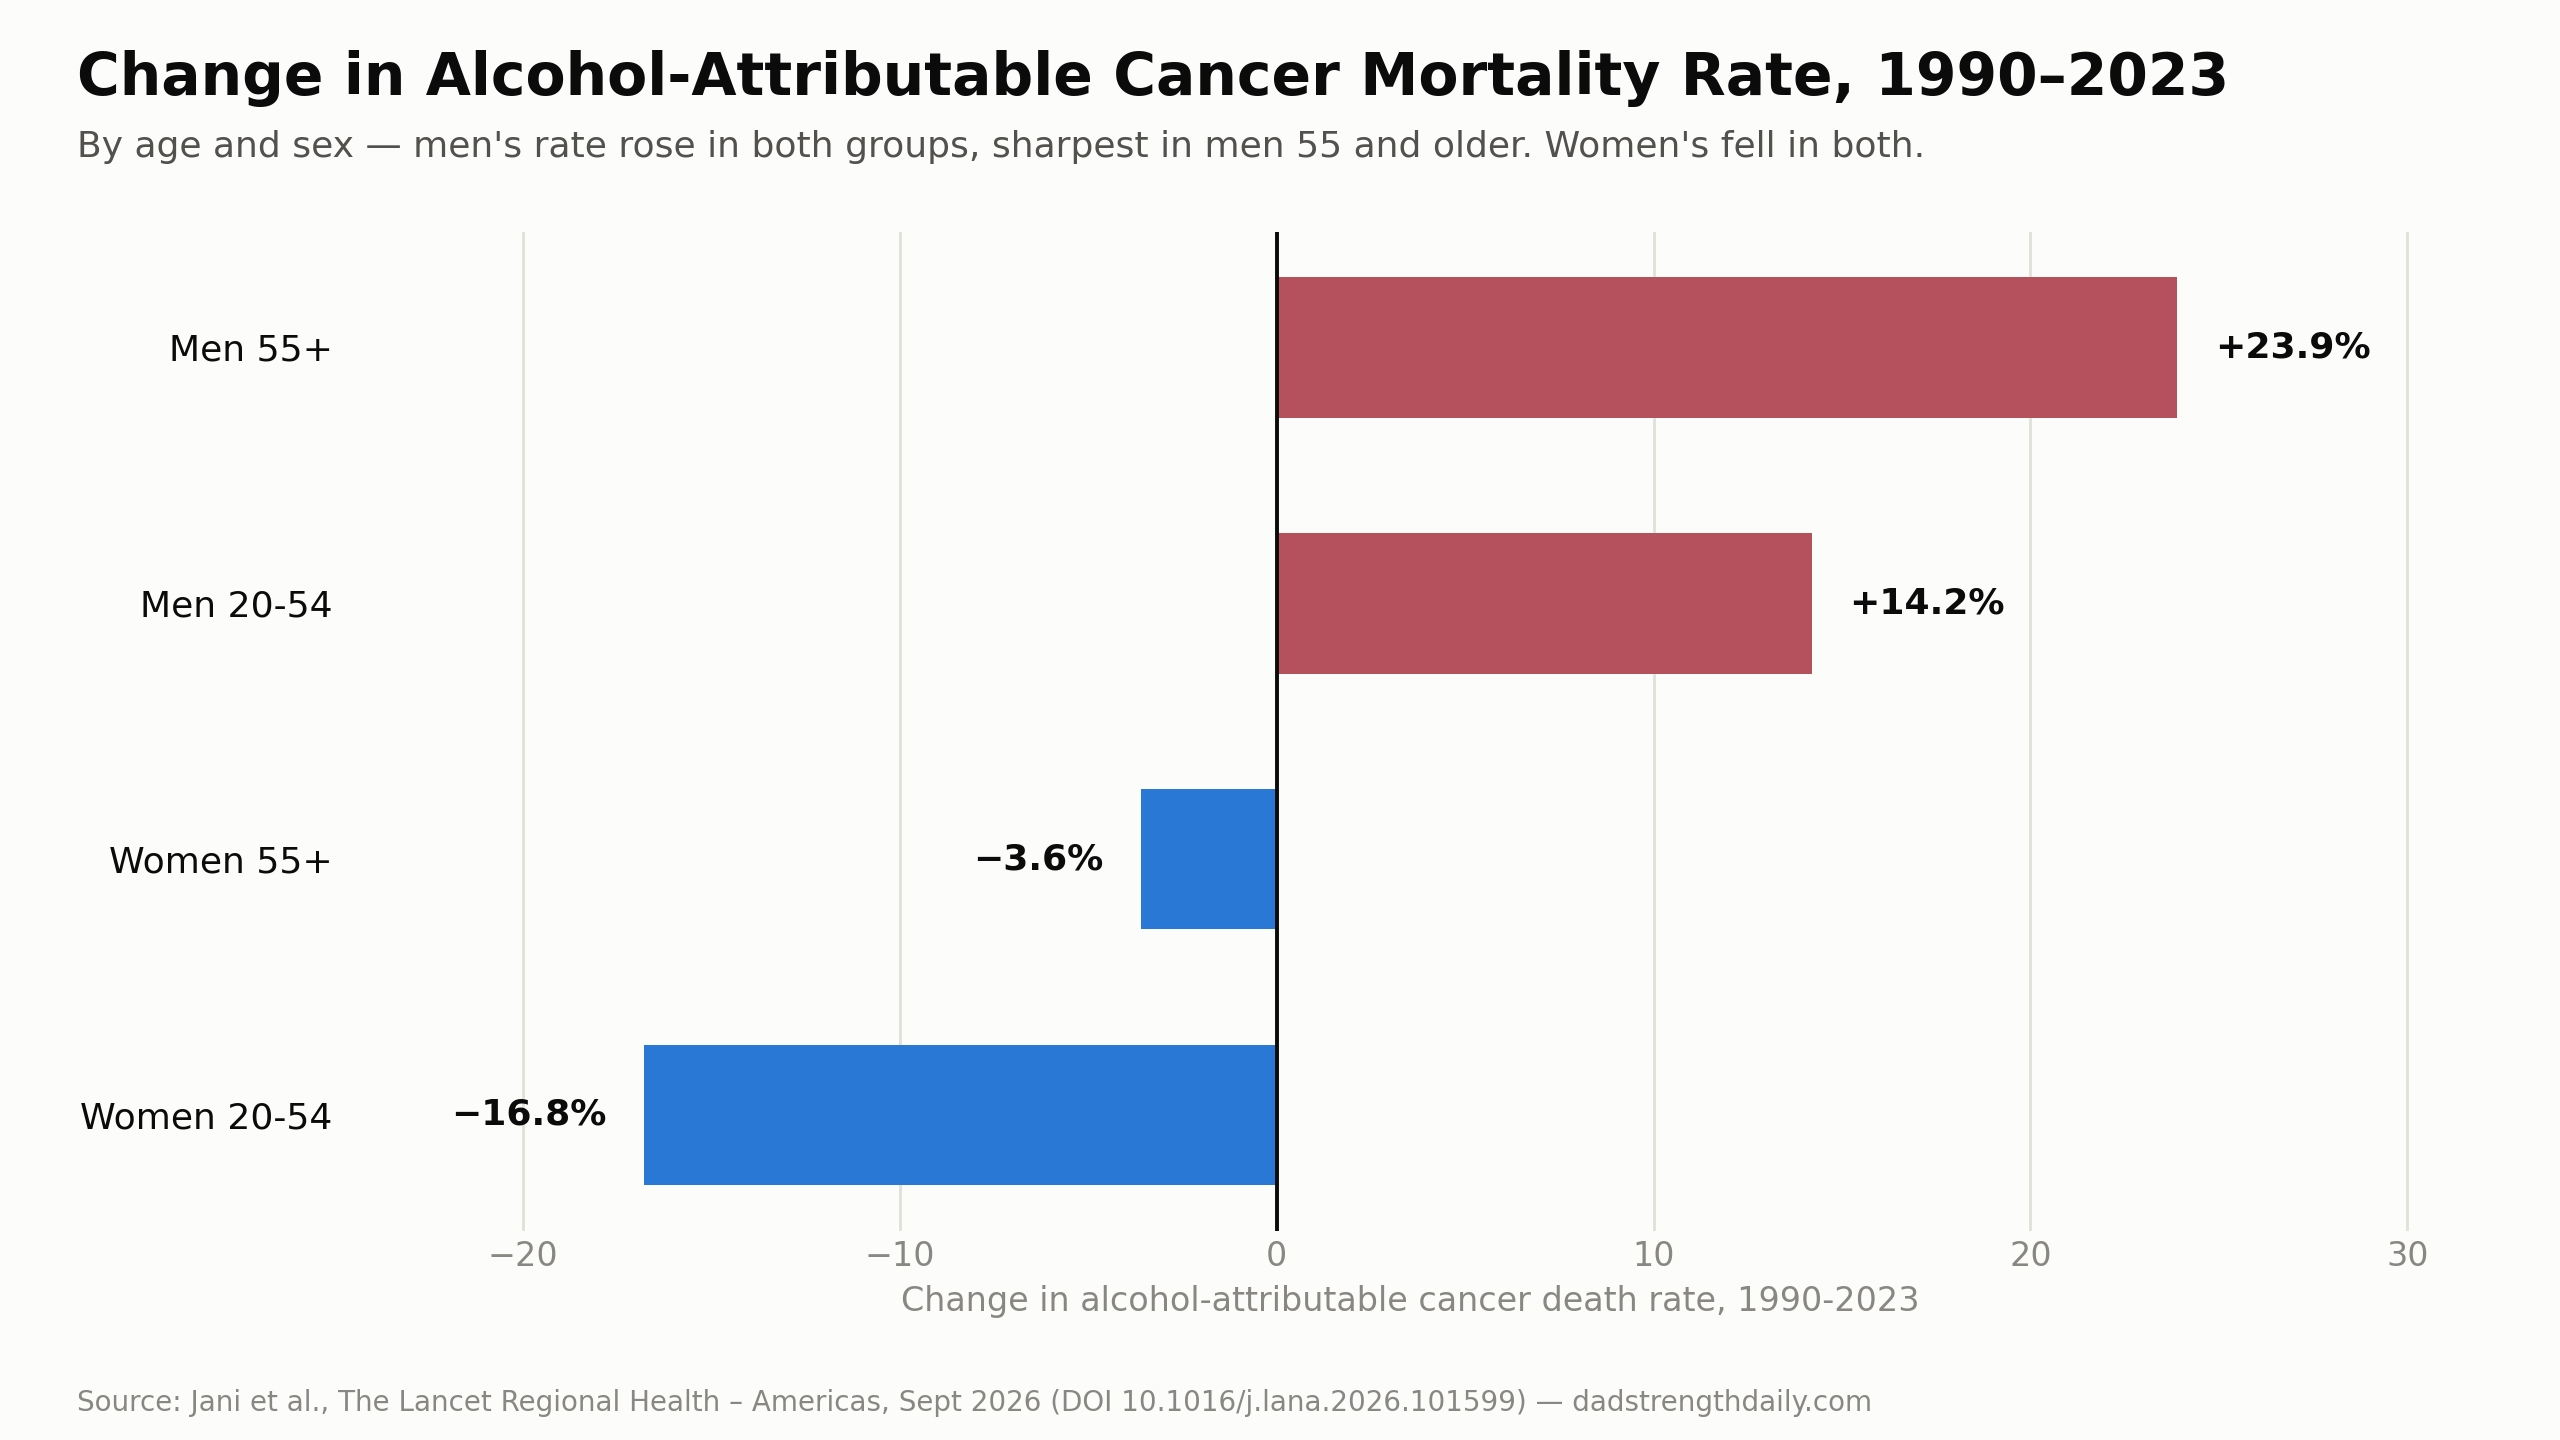
Men 55 and older saw their alcohol-attributable cancer death rate climb 23.9 percent — from 25.9 to 32.1 per 100,000. Women 55 and older saw theirs fall 3.6 percent. The same split shows up, smaller, in the younger group too: men 20 to 54 rose 14.2 percent (2.6 to 2.9), while women 20 to 54 fell 16.8 percent (2.2 to 1.9). Both age groups show the same sex difference, with the largest increase among men 55 and older.
Older men already had close to three times the rate of older women in 1990. Over 33 years, instead of narrowing, that gap widened — the biggest state-level increases were all in men (Oklahoma, New Mexico, West Virginia).
Worth being precise about what this shows. These are population rates, not the same men tracked for three decades — the study can’t tell you an individual drinker’s risk rose exactly 23.9 percent. The estimate also has a wide uncertainty interval: 19.1–49.6 deaths per 100,000. It also doesn’t mean anything special happens on your 55th birthday — that’s the study’s age bracket, not a biological cliff. One more caveat: the 7.6 percent national figure earlier is age-standardized, but these age-band numbers aren’t, so some of the change could reflect an aging population inside the 55-and-older band itself, not just individual risk. Still: for men 55 and older, the estimated annual rate rose from 25.9 to 32.1 deaths per 100,000 — a 23.9 percent increase over 33 years, the number that actually moved for men your age.
Which cancers actually carry the risk
Before the trend lines, the plainer question: which cancers, and how much do they differ by sex? Here’s 2023, ranked.
| Rank | Men 55+ | Rate* | Women 55+ | Rate* |
|---|---|---|---|---|
| 1 | Liver | 12.7 | Breast | 2.4 |
| 2 | Esophageal | 8.0 | Liver | 2.0 |
| 3 | Colorectal | 4.2 | Colorectal | 1.5 |
| 4 | Other pharynx | 1.6 | Esophageal | 0.8 |
| 5 | Lip/oral cavity | 1.5 | Pancreatic | 0.5 |
Liver cancer tops the list for men — 12.7 versus 8.0 for the runner-up, esophageal. For women it’s tighter: breast cancer edges out liver, 2.4 versus 2.0, with uncertainty intervals that overlap enough that I wouldn’t call that gap settled.
Alcohol has been classified a Group 1 carcinogen since 1988 — the same category as tobacco and asbestos in terms of how certain the evidence is that it causes cancer, not how dangerous it is at a given dose. That’s not new — a study that just re-confirmed alcohol causes cancer wouldn’t add anything here.
But the evidence isn’t equally strong across every cancer type, which is part of why this particular list looks the way it does. The canonical dose-response work here is Bagnardi et al. 2015, a meta-analysis of 572 studies and 486,538 cases. It found the strongest links for cancers of the mouth and throat, esophagus, larynx, liver, breast, and colorectum — most of what’s in the table above. Stomach, pancreatic, and lung cancer were weaker and more debated. And prostate cancer, which men this age usually ask about first, isn’t on that list at all. The evidence linking it to alcohol is genuinely mixed.
What’s actually changing
Across the whole study, liver cancer’s alcohol-attributable mortality rose 113.9 percent — the largest jump of any of the 10 cancer types tracked. In men 55 and older specifically, the alcohol-attributable liver cancer death rate went from 6.1 to 12.7 per 100,000, up 109.4 percent. It’s now the single leading alcohol-attributable cancer killer in that group. That 33-year climb wasn’t steady, either — per the paper’s own trend analysis, the overall rate for men 55 and older rose fastest from 2005 to 2018, then showed no significant change from 2018 to 2023. This is a three-decade story, not one still accelerating today.
Interestingly, liver cancer only becomes the top killer for men after 55 — in men 20 to 54, colorectal cancer leads instead, with liver in third. The study itself can’t test why (its own authors say it can’t directly assess anyone’s cumulative drinking history), but it’s consistent with something researchers have proposed elsewhere: liver damage from alcohol is understood to build over decades, which could explain why it climbs the rankings as men age. Breast cancer’s alcohol link doesn’t wait for age 55, though — it’s the top alcohol-attributable cancer for women in both age bands.
What to actually do with this
Two things worth doing this week instead of just reading about it. First, count your actual drinks for two weeks — not your estimate, the real number, written down. Measure the pours and check the label: a standard drink is about 14 grams of pure alcohol — a 12-ounce beer at 5 percent, a 5-ounce glass of wine at 12 percent, or a 1.5-ounce shot of spirits at 40 percent. A heavier pour or a stronger beer or wine adds up fast, which is exactly why most people underestimate until they actually measure. Second, take that number to your doctor and ask what liver assessment makes sense — ALT and AST are often already on a comprehensive metabolic panel, GGT usually isn’t, and there’s no universal annual-physical package. None of these screen for cancer directly; they assess liver health, and normal results don’t rule cancer out. What actually lowers the risk here is straightforward: drinking less. The CDC’s own guidance is that cutting back reduces cancer risk at any level you’re currently drinking.
The number worth remembering isn’t 23,126. It’s 32.1 per 100,000 — the rate for men 55 and older, up from 25.9. Over these 33 years, both male groups rose and both female groups fell. Men 55 and older rose the most.