
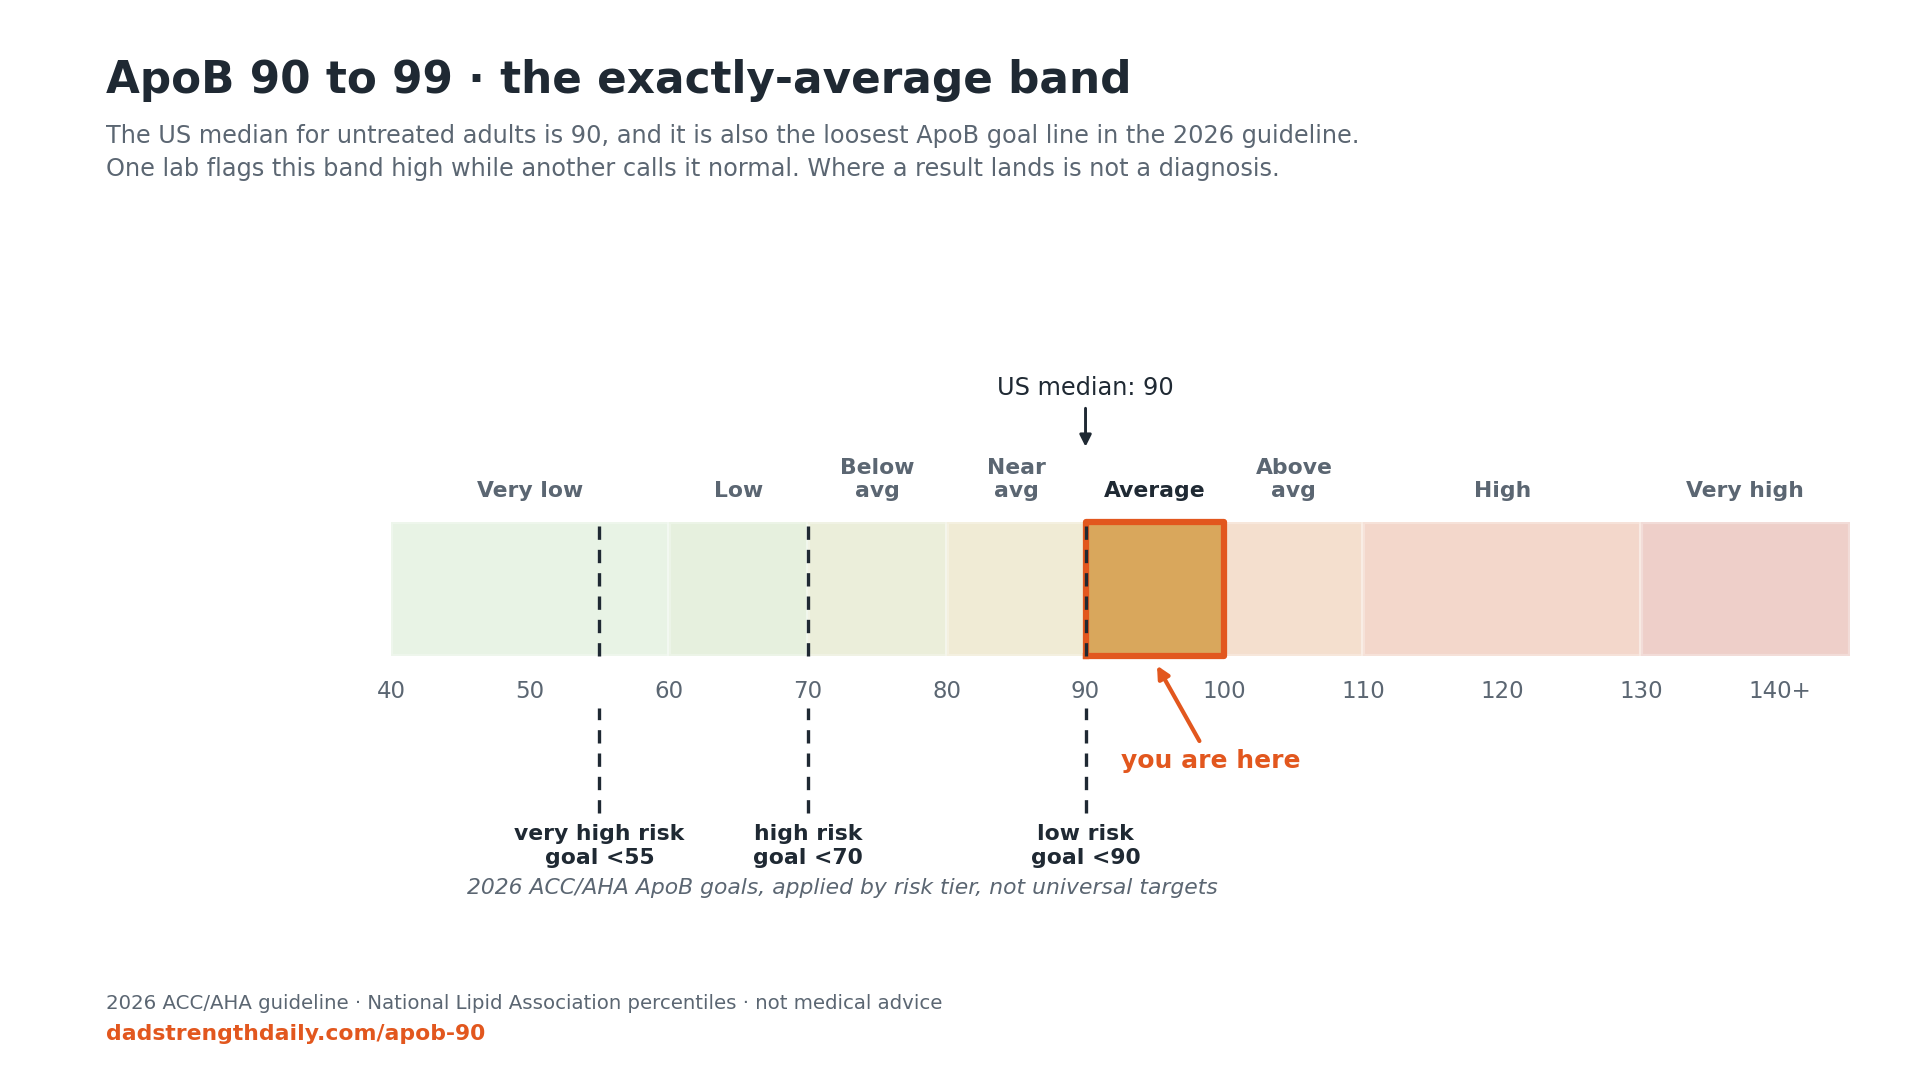
An ApoB of 90 mg/dL is the most average result an American adult can get. ApoB is in effect a particle count: every particle that can push cholesterol into an artery wall carries exactly one copy of it. In the National Lipid Association’s percentile table for untreated US adults, 90 is the 50th percentile. Whether that is reassuring depends on what you think of average American heart health, in a country where heart disease is still the leading cause of death. This page is the 90s entry in the full ApoB levels chart, which covers every band from 40 to 140 and up.
The strange thing about a 90 is that your lab report may not even agree with itself from one company to the next. My own first ApoB came back at 95, and Labcorp flagged it high, because Labcorp’s reference range tops out at 90. Cleveland Clinic publishes a normal range for men of 66 to 133, so the identical blood would have passed there without comment. A 90, or a 92, 93 or 95, sits exactly where the labs argue with each other: flagged at one company, mid-normal at another. The flag is telling you about the lab’s reference population, not about your arteries.
What a 90 means under the 2026 guideline
The March 2026 ACC/AHA dyslipidemia guideline handed ApoB a much bigger clinical role than the 2018 edition gave it, and its goal tiers are the useful frame here. Where it sets an ApoB goal at all, the loosest is under 90; the higher-risk tiers get under 70 and under 55. Those are goals for people with a treatment indication, not targets stamped on every adult. Still, half of untreated American adults walk around at or above the loosest goal line in the document.
If you are not on any cholesterol medication, the guideline’s honest position is that your 90 is context-dependent. It says measuring ApoB in untreated adults “may be reasonable” to sharpen risk assessment, which is the guideline’s weakest grade of yes, and it wants the rest of your picture before anyone reaches for a prescription. That means an Lp(a) test at least once in your life (a mostly genetic particle your regular panel never measures), your family history, how your metabolic health looks, and sometimes a CAC scan, the CT that counts the calcified plaque already sitting in your coronary arteries. A 90 with an Lp(a) of 10 and a CAC of zero is a genuinely different situation from a 90 with a high Lp(a) and a father who had a heart attack at 55. The first situation mostly buys you time; the second is a reason to take the 90 seriously now.
If you are already on a statin or another lipid drug, a 90 reads differently: where an ApoB goal applies to you at all, a 90 clears none of them, and the guideline says checking ApoB to guide whether treatment should go further “is reasonable”, a firmer yes than the untreated case gets, especially with established heart disease, type 2 diabetes, kidney or metabolic disease, or high triglycerides. If I were on a lipid drug and still seeing 90, I would be asking my doctor whether the treatment is doing enough.
Get the next one in your inbox
I write about longevity, training, and preventive health weekly — without the guru worship. Free, no spam, unsubscribe whenever.
Average is a rate, not a grade
The word “normal” does too much work here. I would not panic over a 90. What would worry me is the same 90 showing up year after year, because atherosclerosis reflects particle exposure over decades, and holding the American average for twenty more years is how you buy the American average outcome. The 2026 guideline moved its whole structure toward that lifetime view: risk assessment now starts at age 30 and adds a 30-year estimate for younger adults, precisely because a low short-term risk number can hide decades of accumulation.
That is also why 90 is not a cliff edge. An 89 and a 92 are the same biology; the band matters more than the integer.
What I did with mine
My 95 became 59 in about a year, on weight loss, the GLP-1 that made the weight loss happen, and a cheap generic called ezetimibe, never a statin; the whole year is written up here. That is a report, not a protocol; my doctor and I picked it for my risk picture, and yours may point somewhere else entirely. The honest lesson from my own numbers is just that a mid-90s ApoB was movable with unglamorous tools. What an ApoB in the 60s asks of you next turned out to be its own question, and it has its own page.
If your 90 came off a panel you paid for yourself, retesting is cheap enough to make trends instead of single data points: I priced a standalone ApoB test at thirteen self-order services and the checkout totals run $19 to $69. And if you have never pulled apart the rest of the panel the 90 arrived on, the plain-English guide to the 2026 changes is where I would start.
A 90 is not an emergency. It is exposure at the national average rate, and the new guideline finally treats decades of exposure as the thing that matters. What you do about yours is a conversation for you and your clinician; the chart only tells you where you stand.
The guideline referenced throughout is the 2026 ACC/AHA multisociety dyslipidemia guideline (Circulation, March 13, 2026); the percentile figures are the National Lipid Association’s.
I am an engineer who reads trial data, not a physician. Nothing here is medical advice; decisions about testing and treatment belong with your clinician.