
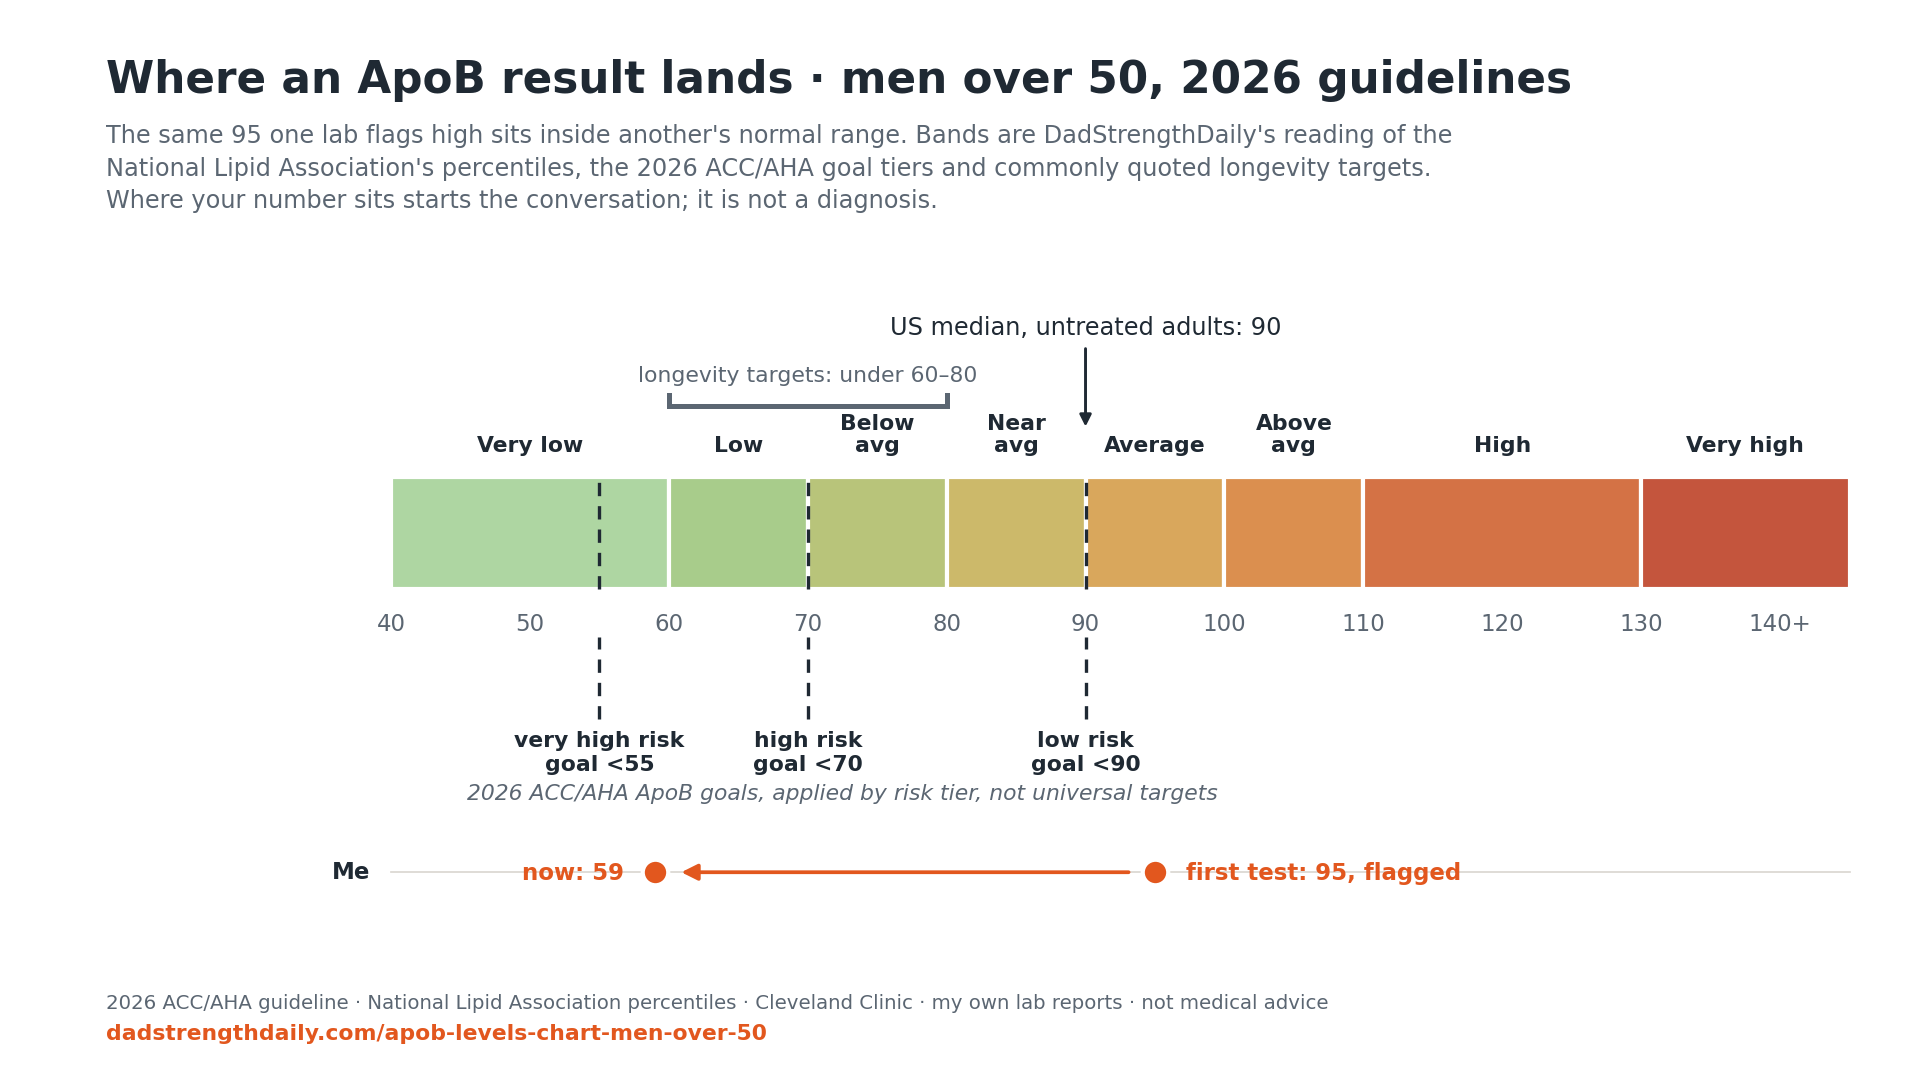
My first ApoB result was 95 mg/dL, in May 2025. Labcorp flagged it high, because Labcorp’s reference range tops out at 90. Cleveland Clinic publishes a normal range for men of 66 to 133, so the same tube of blood at a different lab would have come back with no flag at all. Whether my 95 was a problem turned out to depend entirely on who I asked, and as of March 2026 the cardiology establishment has an official answer.
This page is the chart I wish I had that morning: every ApoB band from 40 to 140 and up, what the new guideline says about it, where the longevity crowd disagrees, and the point at which the number should change the conversation with your doctor. Mine is 59 now.
ApoB counts particles, not cargo
A standard lipid panel measures LDL-C: the total weight of cholesterol riding inside LDL particles. ApoB counts the particles themselves. Every LDL, VLDL, IDL and Lp(a) particle carries exactly one apolipoprotein B molecule, so the ApoB number is a direct particle count.
That matters because atherosclerosis is driven by particles crossing into the artery wall and getting stuck. Two men can carry the same LDL-C with very different particle counts, and the particle count predicts events better. In the primary-prevention analysis the 2026 guideline cites, LDL-C, non-HDL-C and ApoB each predict heart attacks individually, but when they are assessed together only ApoB stays significant, at an adjusted hazard ratio of 1.27 per standard deviation.
The two numbers disagree often enough to matter, a state called discordance. LDL-C can sit at goal while ApoB stays elevated, and the guideline says that pattern concentrates in exactly the profiles common at our age: diabetes, CKM syndrome, and triglycerides at or above 150 mg/dL. If your metabolic history includes any of those, the standard panel is most likely to flatter you.
Get the next one in your inbox
I write about longevity, training, and preventive health weekly — without the guru worship. Free, no spam, unsubscribe whenever.
What changed in March 2026
The ACC, AHA and nine other medical organizations published a new dyslipidemia guideline on March 13, 2026, the first full rewrite since 2018. I went through it looking for what actually changed for someone like me.
ApoB is finally in the document as something doctors are told they can use, though the grading is weaker than the headlines made it sound. The strongest recommendation is for people already on cholesterol medication: once LDL-C or non-HDL-C is at goal, checking ApoB to decide whether treatment should go further “is reasonable,” Class 2a, especially with diabetes, CKM syndrome, high triglycerides or established disease. For everyone else, testing “may be reasonable” to sharpen risk assessment. That is Class 2b, the guideline’s polite shrug. Compare Lp(a): every adult, at least once, Class 1. So the authors accept the case for counting particles, but they are not ready to make ApoB the treatment target, and they say outright that its best role there is still an open question.
The goals did change. The guideline’s tiers run LDL-C under 100, 70 and 55 mg/dL with non-HDL-C under 130, 100 and 85, and it now attaches ApoB goals of under 90, under 70 and, in selected very-high-risk settings, under 55, depending on the patient’s risk profile. They are conditional goals for specific situations, not universal parallel targets. But where an ApoB goal appears at all, the loosest one is 90, which happens to be where Labcorp drew the flag line on my result.
And the whole frame moved to lifetime exposure. The old risk calculator is gone, replaced by the PREVENT equations. Risk assessment now starts at age 30 instead of 40; PREVENT estimates 10-year risk through age 79 and adds a 30-year view for younger adults, where a low short-term number can hide decades of exposure. Plaque tracks cumulative particle burden rather than this year’s result, and the researchers who spent two decades arguing exactly that mostly won. Adoption in routine practice will be uneven for a while yet.
The ApoB chart: percentiles from 40 to 140+
Population context first, because “normal” does a lot of quiet work here. In the National Lipid Association’s percentile table for untreated US adults, an ApoB of 90 is the 50th percentile, and 97 is the 60th. Average American is a low bar; heart disease is still the number-one killer of that population.
Two notes on the chart itself. The bands below are my practical interpretation of population percentiles, guideline targets and longevity-oriented targets; they are not official ACC/AHA ApoB categories. And the targets are not specific to men over 50. The guideline’s numbers apply to adults generally; what changes with age is how much cumulative exposure you already carry and what your absolute risk looks like.
| Your value | What it means at 50 |
|---|---|
| ApoB 40 | Very low (40–49). Below every treatment threshold and at or below the most aggressive longevity targets. Territory of secondary-prevention drug therapy or lucky genetics. Nothing to optimize. |
| ApoB 41 | |
| ApoB 42 | |
| ApoB 43 | |
| ApoB 44 | |
| ApoB 45 | |
| ApoB 46 | |
| ApoB 47 | |
| ApoB 48 | |
| ApoB 49 | |
| ApoB 50 | Very low (50–59). Below the guideline’s most aggressive goal line of 55 at the bottom of the band, and below or at the common longevity targets throughout it. Excellent. Maintain, retest occasionally. |
| ApoB 51 | |
| ApoB 52 | |
| ApoB 53 | |
| ApoB 54 | |
| ApoB 55 | |
| ApoB 56 | |
| ApoB 57 | |
| ApoB 58 | |
| ApoB 59 | |
| ApoB 60 – full breakdown → | Low (60–69). Inside the guideline’s under-70 goal tier for most of the band, and at or near the common longevity targets of under 60 to 70. Very good. This is where the lifetime-risk minimizers aim. |
| ApoB 61 | |
| ApoB 62 | |
| ApoB 63 | |
| ApoB 64 | |
| ApoB 65 | |
| ApoB 66 | |
| ApoB 67 | |
| ApoB 68 | |
| ApoB 69 | |
| ApoB 70 | Below average (70–79). Around the 20th to 30th percentile for untreated US adults. Above the guideline’s two stricter goal tiers, below its under-90 tier. Whether to push lower is a philosophy question, not an urgency question. |
| ApoB 71 | |
| ApoB 72 | |
| ApoB 73 | |
| ApoB 74 | |
| ApoB 75 | |
| ApoB 76 | |
| ApoB 77 | |
| ApoB 78 | |
| ApoB 79 | |
| ApoB 80 | Near average (80–89). Roughly the 40th percentile. Below the guideline’s least aggressive goal line, above the stricter two, and the zone longevity-minded clinicians call room to improve. The genuinely gray band, where the rest of your chart decides: your Lp(a), a CAC score if you have one, and your family history. |
| ApoB 81 | |
| ApoB 82 | |
| ApoB 83 | |
| ApoB 84 | |
| ApoB 85 | |
| ApoB 86 | |
| ApoB 87 | |
| ApoB 88 | |
| ApoB 89 | |
| ApoB 90 – full breakdown → | Average (90–99). ApoB 90 is the literal median for untreated US adults, and 97 is the 60th percentile. Some labs flag this band high, others call it normal; my own 95 was flagged by Labcorp and would have passed at Cleveland Clinic. It is also above the guideline’s under-90 goal for even the lowest-risk treated tier. This band is why this page exists. |
| ApoB 91 | |
| ApoB 92 | |
| ApoB 93 | |
| ApoB 94 | |
| ApoB 95 | |
| ApoB 96 | |
| ApoB 97 | |
| ApoB 98 | |
| ApoB 99 | |
| ApoB 100 | Above average (100–109). Roughly the 60th to 70th percentile, and above every goal line in the 2026 guideline’s tiers. Clearly elevated by longevity standards. Time to bring it to your doctor; the lifetime math is against you here. |
| ApoB 101 | |
| ApoB 102 | |
| ApoB 103 | |
| ApoB 104 | |
| ApoB 105 | |
| ApoB 106 | |
| ApoB 107 | |
| ApoB 108 | |
| ApoB 109 | |
| ApoB 110 | High (110–119). Roughly the 70th to 80th percentile. Elevated by guideline standards; expect a real treatment discussion, especially with any second risk factor. |
| ApoB 111 | |
| ApoB 112 | |
| ApoB 113 | |
| ApoB 114 | |
| ApoB 115 | |
| ApoB 116 | |
| ApoB 117 | |
| ApoB 118 | |
| ApoB 119 | |
| ApoB 120 | High (120–129). Above the 80th percentile. Treatment-discussion territory for most profiles. At 50 you likely have decades of exposure ahead; this is the band where later gets expensive. |
| ApoB 121 | |
| ApoB 122 | |
| ApoB 123 | |
| ApoB 124 | |
| ApoB 125 | |
| ApoB 126 | |
| ApoB 127 | |
| ApoB 128 | |
| ApoB 129 | |
| ApoB 130 | Very high (130–139). Around the 90th percentile and elevated by any framework. Rule out secondary causes and familial patterns, and expect your doctor to bring up treatment. |
| ApoB 131 | |
| ApoB 132 | |
| ApoB 133 | |
| ApoB 134 | |
| ApoB 135 | |
| ApoB 136 | |
| ApoB 137 | |
| ApoB 138 | |
| ApoB 139 | |
| ApoB 140+ | Very high (140 and above). Above the 95th percentile. Strong treatment indication, and a familial hypercholesterolemia workup is reasonable. See your doctor soon. |
Two caveats on the table. First, the bands are a gradient, not cliffs; 95 is not categorically different from 89, it just banks lifetime exposure a little faster. Second, your number travels with context. An ApoB of 95 next to an Lp(a) of 10 nmol/L, a CAC score of zero and good metabolic health is a different situation than the same 95 next to a high Lp(a) and a father who had his first heart attack at 55. The 2026 guideline is built around that layering, which is why it wants Lp(a) once in every lifetime and uses CAC selectively. This page tells you where your number sits. What to do about it belongs with your clinician, ideally one who has read the new guideline.
Guideline targets vs. longevity targets
The gap between mainstream cardiology and the longevity crowd is smaller than it used to be, but it is still real. Guideline logic works backward from trial evidence: treat when predicted risk clears a threshold, aim for the goal tiers above. The longevity school runs the other direction. This is Sniderman’s particle argument and the Mendelian-randomization work Attia popularized: particles cause the disease, exposure compounds for decades, so get ApoB down to where heart disease is rare, usually quoted as somewhere under 60 to 80 mg/dL depending on who you read.
The 2026 guideline reads much closer to the second camp than 2018 did. This is how Attia and lipidologists like Sniderman have talked about ApoB for years: start paying attention earlier, care about cumulative exposure. It still stops short of telling a healthy 50-year-old with an ApoB of 92 to treat. Whether you stop there is a values question about how much lifetime risk you are willing to bank, and it is worth deciding deliberately rather than by default.
Getting the number
If you have never seen an ApoB on your labs, that is normal; it is still not part of a standard panel. It is a cheap add-on blood test, insurance coverage is inconsistent, and cash prices run lower than most people expect. I priced it at thirteen self-order services on the same day and published the checkout totals in the ApoB test cost breakdown. Under the 2026 guideline you now have an official basis to request it from your doctor, particularly if your triglycerides run high, your LDL-C is already treated to goal, or your metabolic history is complicated. The test does not require fasting. If you are building a full baseline rather than chasing one number, the heart bloodwork guide covers the rest of the panel.
Retest cadence: ApoB responds to the same things LDL-C responds to, meaning diet composition, weight change and drugs, so the guideline’s rhythm for people on treatment is a lipid panel 4 to 12 weeks after any change and every 6 to 12 months once stable. My own version while losing weight was a test roughly every quarter; that is how I watched 95 become 59 in just over a year. What moved it was the weight itself, a GLP-1 and a cheap generic called ezetimibe, never a statin; that year has its own post.
FAQ
Is ApoB more important than LDL cholesterol?
When they disagree, ApoB is the better predictor; in the analysis the 2026 guideline cites, only ApoB stays significant when the lipid markers are assessed together. When they agree, they tell the same story. The value of ApoB is catching the cases where LDL-C flatters you.
Can exercise and diet lower ApoB?
Yes. The same interventions that lower LDL-C lower ApoB: less saturated fat, more fiber and unsaturated fat, losing visceral fat, improving insulin sensitivity. The reductions from committed lifestyle change are real but usually modest. Genetics sets the floor. When the floor is not low enough, the drug conversation starts at statins and now runs to an oral PCSK9 pill.
What is the difference between ApoB and Lp(a)?
Lp(a) is one specific particle type inside the ApoB count, and the guideline now recommends every adult get it measured at least once. Get both. Lp(a) is mostly inherited and barely moves, so once is usually enough; the Lp(a) guide covers that number and what the test costs. ApoB is the one you can actually track while you change your diet, lose weight or start a drug.
My LDL is normal. Do I still need ApoB?
That is precisely the case where ApoB adds information. Normal LDL-C alongside elevated triglycerides, prediabetes or central adiposity is the classic discordance profile the guideline describes.
What ApoB level should a 50-year-old man aim for?
There is no single answer, and anyone giving you one number without asking about your Lp(a), CAC and family history is skipping the hard part. The guideline’s treated tiers run under 90, 70 or 55 by risk; longevity frameworks argue for under 60 to 80. The chart above shows both.
Sources
- 2026 ACC/AHA Multisociety Guideline on the Management of Dyslipidemia, Circulation, March 13, 2026. The ApoB recommendations, goal tiers and PREVENT changes described above are from this document.
- National Lipid Association, Learn Your Lipids: Apolipoprotein B. The percentile figures for untreated US adults.
- Cleveland Clinic: Apolipoprotein B test. The 66-to-133 mg/dL male reference range.
I am an engineer who reads trial data, not a physician. This page explains where numbers sit relative to published guidelines and research; it is not medical advice. Decisions about testing and treatment belong with your clinician.